Ute Conference Hosts Second Referee Training for 2024 Season
UC Football
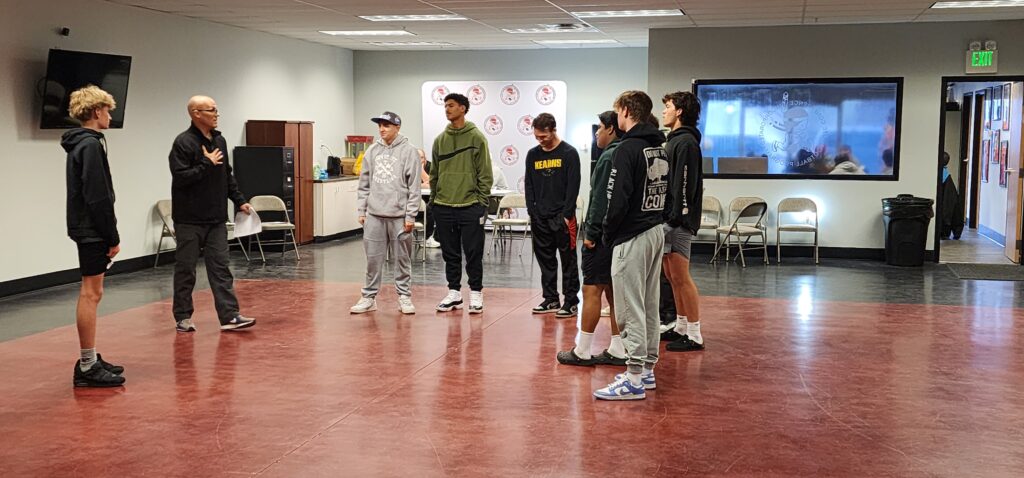
Going Beyond Motivation
UC Football
Tyler Johnson: Positive Coaching Alliance
UC Football
The Hope Experience
UC Football
David Nixon: Former NFL Linebacker
UC Football
Our UC Districts
Davis
Syracuse
Alta
Bingham
Bountiful
Brighton
Cedar Valley
Copper Hills
Corner Canyon
Cottonwood
Cyprus
East
Grantsville
Herriman
Highland
Hillcrest
Hunter
Juan Diego
Kearns
Layton
Mountain Ridge
Murray
Northridge
Olympus
Orem
Park City
Riverton
Skyline
South Summit
Stansbury
Taylorsville
Tooele
Wasatch
West
West Jordan
Westlake
Woods Cross
Granger
Freemont
Ogden
Farmington
Clearfield
Viewmont
West Field
Weber
Roy
Box Elder
Lehi
Join our CORE Team
Are you passionate about supporting youth sports and making a positive impact on the community? We are currently seeking a 1099 Contractor who has experience in running youth sports organizations. Seeking someone who is passionate at assisting in moving the UC forward with our existing team.
Note: UCR’s, Presidents, and Board Members of current districts along with current coaches in the UC will not be considered. Past presidents, coaches and board members will be considered.
Qualifications:
– Minimum of 3 years of youth sports experience. – Strong communication and interpersonal skills. – Ability to work independently and collaboratively in a team.
Types of working projects and requirements:
1. Social Media Management: – Develop and maintain social media presence. – Create engaging content to promote events, achievements, and community involvement.
2. Database Management: – Handle data entry and maintenance of the organization’s database. – Ensure accurate and up-to-date information for players, coaches, and volunteers.
3. Spreadsheet Expertise: – Proficient in Excel for tracking and analyzing various data points. – Assist in creating and managing game schedules and platforms, assist in tournaments and referee placement.
4. Graphic Design Skills: – Utilize Adobe Illustrator for designing promotional materials, banners, and graphics. – Collaborate with the marketing team to enhance visual content. – Create and collaborate in the uniform design process.
5. Basic Accounting Knowledge: – Support the finance team with basic accounting tasks. – Assist in budget tracking, and financial reporting.
Requirements:
– Strong organizational and multitasking skills. – Proficiency in social media platforms and content creation. – Experience with database management and data entry. – Advanced skills in Microsoft Excel for spreadsheet management. – Familiarity with Adobe Illustrator for graphic design. – Basic accounting knowledge is a plus.
1. If I provide any false statements or material misrepresentations on my background check, or if my background check responses are materially incomplete or misleading;
2. If I fail or refuse to complete the background screening process;
3. If my name appears on any sex offender registries;
4. If I have any conviction (including a guilty plea or plea in abeyance or a plea of nolo contendere) for any sexual offense or acts of sexual misconduct, irrespective of the date or whether the conviction was for a felony or misdemeanor;
5. If I have any conviction (including a guilty plea or plea in abeyance or a plea of nolo contendere) for any felony classified or deemed to be a “violent” felony, irrespective of the date or whether the conviction was for a felony or misdemeanor;
6. If I have any conviction (including a guilty plea or plea in abeyance or a plea of nolo contendere) for child abuse or domestic violence, (excluding Class B or C child abuse or domestic violence convictions) irrespective of the date or whether the conviction was for a felony or misdemeanor;
7. If I have any conviction (including a guilty plea or plea in abeyance or a plea of nolo contendere) for drug or alcohol related offenses (excluding Class B or C DUI convictions), irrespective of the date or whether the conviction was for a felony or misdemeanor;
8. If I have any other felony conviction within the past seven (7) years;
9. If I have any other misdemeanor conviction (class A) within the past two (2) years;
10. If I have any pending and unresolved felony or misdemeanor (class A) charges;
The UC has 12 AI cameras that require camera techs to operate. These cameras are not the typical sport cameras and provide 4K broadcasting quality recordings. Minimum requirements for this position are:
At least 18 years of age
Reliable transportation
Great communication skills including the ability to talk to strangers
Must pass a background check and UC Photographer/Videographer Certification course
Duties:
Set up, start, and monitor AI Cameras on Saturdays during the 2023 UC Season.
Troubleshoot cameras if technical problems arise.
Deliver media to the UC via web upload
Compensation: $18/hr
Photographer & Videographer
Media Team Application
The UC has 12 AI cameras that require camera techs to operate. These cameras are not the typical sport cameras and provide 4K broadcasting quality in their video. You must meet the minimum qualifications:
At least 18 years of age
Duties:
Take photos/video (depending on role) of various youth football games on Saturdays.
May be asked to operate camera gear provided by the UC.
Deliver media to the UC via web upload
Compensation: Depends on Experience
Photographer & Videographer
First Aid/CPR/AED Classes
Please select a valid form
Login To Your Parent Account
Please report any errors in the registration process